

Wait {{customer_first_name}}! Your Purchase is Not Complete Yet.
We think you'll love this deal!
Start Saving Your Time Right NOW
Transform Your Work Planning and Achieve Next-Level Productivity
Project Management Google Sheets Templates Bundle—your all-in-one solution for efficient project oversight. This comprehensive collection offers nine meticulously crafted templates, each designed to streamline various facets of project management. Accessible online from any device, these user-friendly tools require no additional software, ensuring seamless collaboration with your team.
- 100% Google Sheets-Based: Access your files anytime, anywhere, on any device.
Our
Evergreen Project Management Excel Spreadsheet & Google Sheet Bundle
collection includes

- Action Plan Template
- Kaban Board
- Eisenhower-Matrix
- Gantt Chart Template
- Decision-Matrix
- Project Roadmap Template
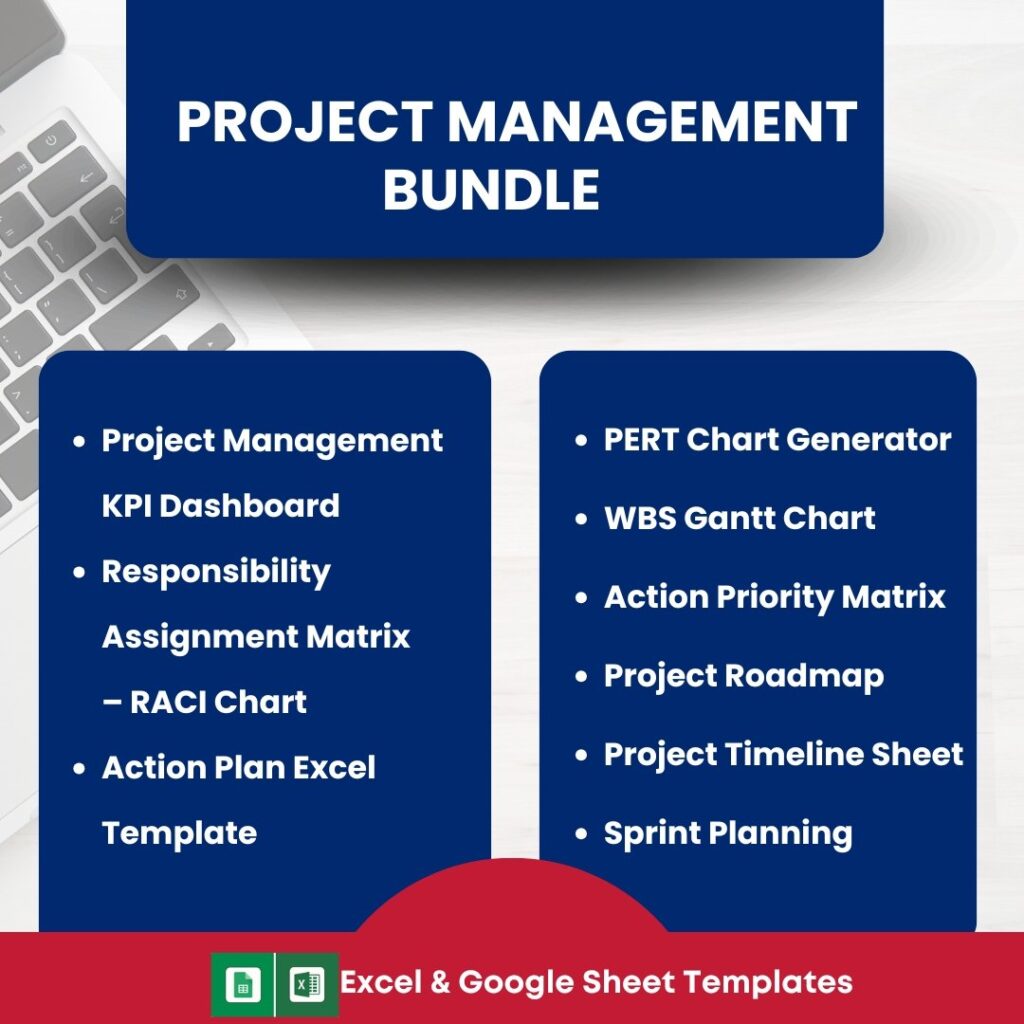
- Project Management KPI Dashboard
- Sprint Planning Template
- Action Priority Matrix
- Project Task List
- Project Timeline
- Responsibility Assignment Matrix
- Issue Tracker Template
- Employee Task List Template
Total Value: $1,485
For Only $297
As a project manager, entrepreneur, or business owner, you already have enough on your plate—why spend hours creating project tracking spreadsheets from scratch? We’ve compiled a collection of easy-to-use, professional Project Management Google Sheets Templates designed to save you time and effort.
With our Project Management Templates Bundle & Dashboard, you can instantly plan, track, and manage your projects without the hassle. Whether you’re overseeing a team, handling multiple projects, or managing client deliverables, these templates will streamline your workflow, improve collaboration, and keep your projects on track effortlessly.
HERE IS WHAT TO GET WITH FUTURE UPDATES
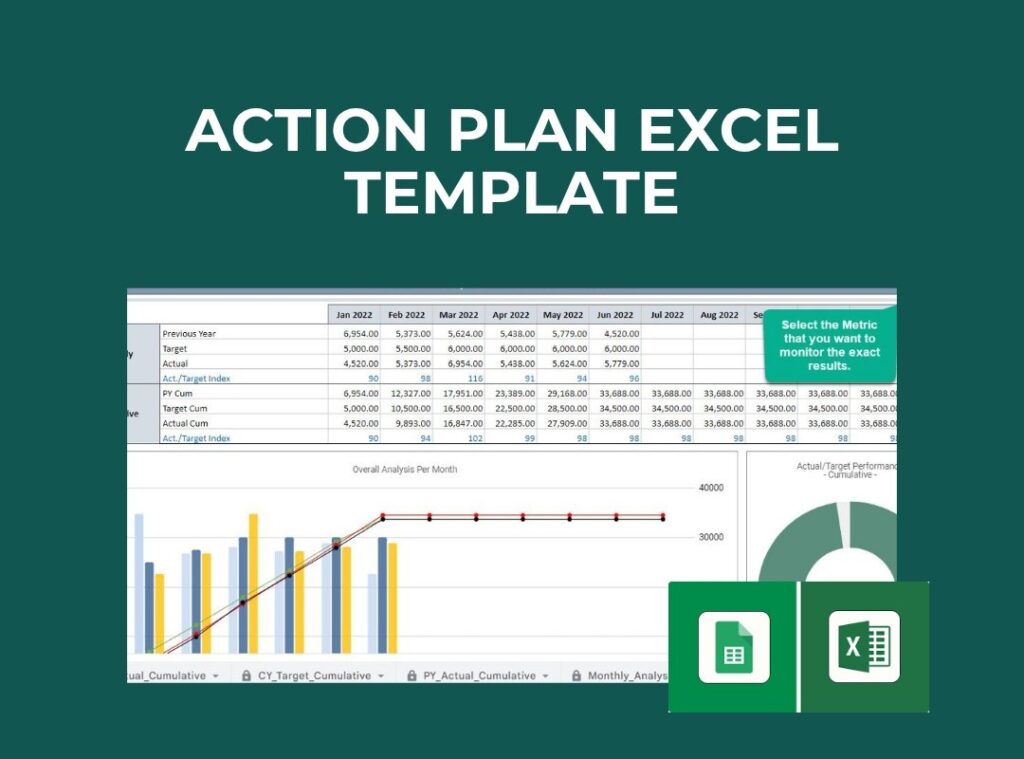
Action Plan Template
Define your objectives, outline actionable steps, and monitor progress to achieve your goals systematically. This template helps you set clear goals, define actionable steps, and track progress to completion.
- Keep your team aligned on objectives
- Ensure every task contributes to the bigger picture
- Stay accountable with progress tracking
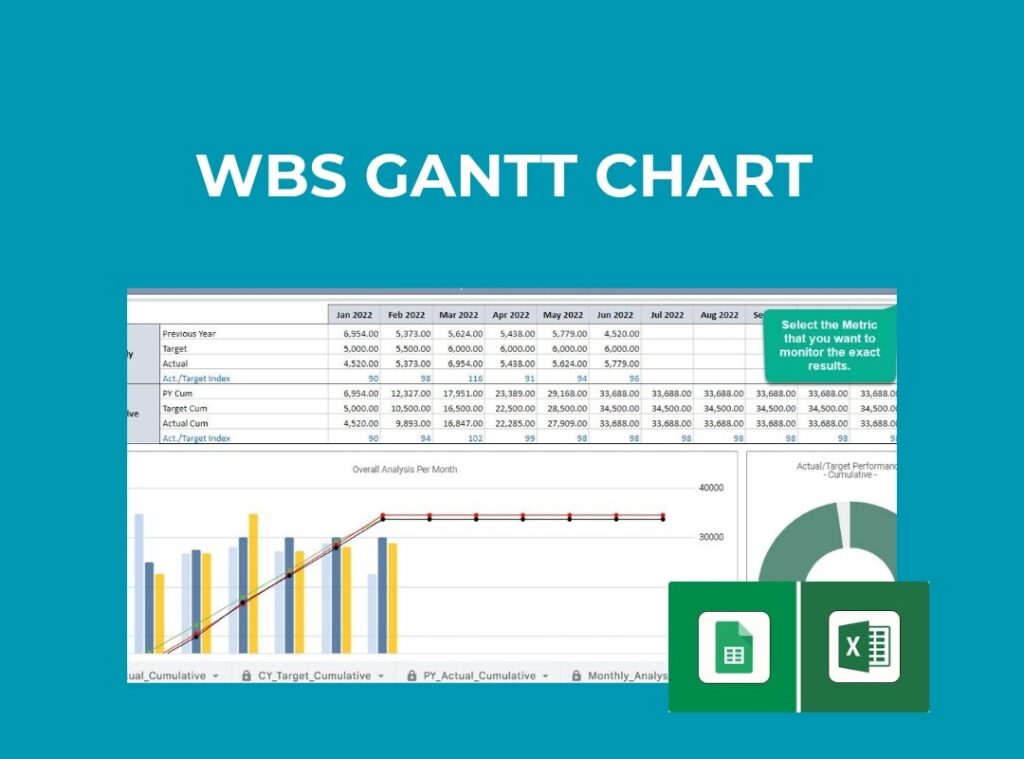
Gantt Chart Template
Plan and schedule project timelines with clarity, ensuring all tasks are aligned and deadlines are met. Never miss a deadline again! Visualize project timelines, track dependencies, and ensure seamless execution with this intuitive Gantt Chart.
- Plan your project timeline effectively
- Identify bottlenecks and dependencies early
- Adjust schedules in real time for flexibility

Kanban-Board
A visual task management tool to track workflow and progress in real-time. Ideal for teams working in Agile or Lean environments.
- Drag-and-drop task management
- See work progress at a glance
- Eliminate bottlenecks and increase efficiency
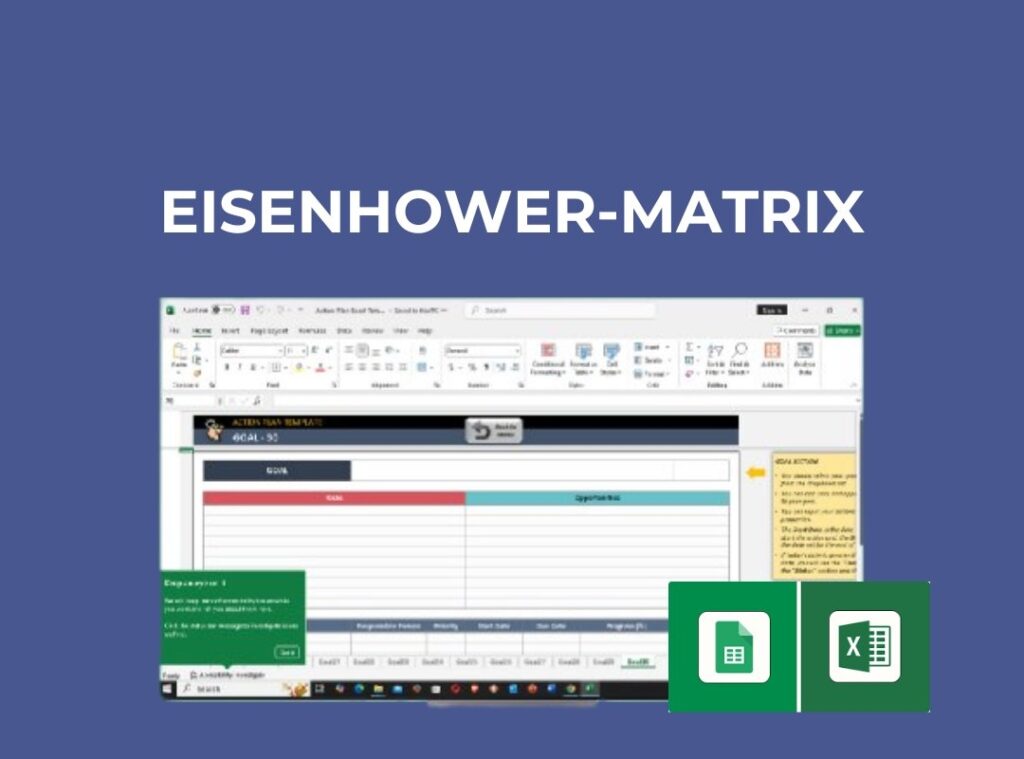
Eisenhower-Matrix
Prioritize tasks like a CEO! This proven decision-making tool helps you focus on what truly matters by categorizing tasks by urgency and importance.
- Helps eliminate time-wasting activities
- Ensures important tasks don’t get neglected
- Reduces stress and improves focus

Decision-Matrix
Make smarter, data-driven decisions by evaluating multiple options side by side. Ideal for project planning, hiring, or strategy development.
- Helps make logical, unbiased decisions
- Reduces risk by weighing all possible factors
- Great for team collaboration and voting

Project Roadmap Template
Visualize the project’s trajectory, highlighting key milestones and deliverables to keep the team aligned. See the big picture! This roadmap visually lays out project phases, milestones, and deliverables, ensuring everyone stays aligned.
- Communicate project vision to stakeholders
- Identify critical deadlines and key deliverables
- Keep your team motivated with clear objectives

Project Management KPI Dashboard
Monitor key performance indicators in real-time to assess project health and make informed decisions. Stay on top of your project’s performance with real-time KPI tracking. Get key insights into efficiency, budget, and timelines.
- Monitor project health with dynamic charts
- Make data-driven decisions quickly
- Track multiple KPIs in one centralized dashboard
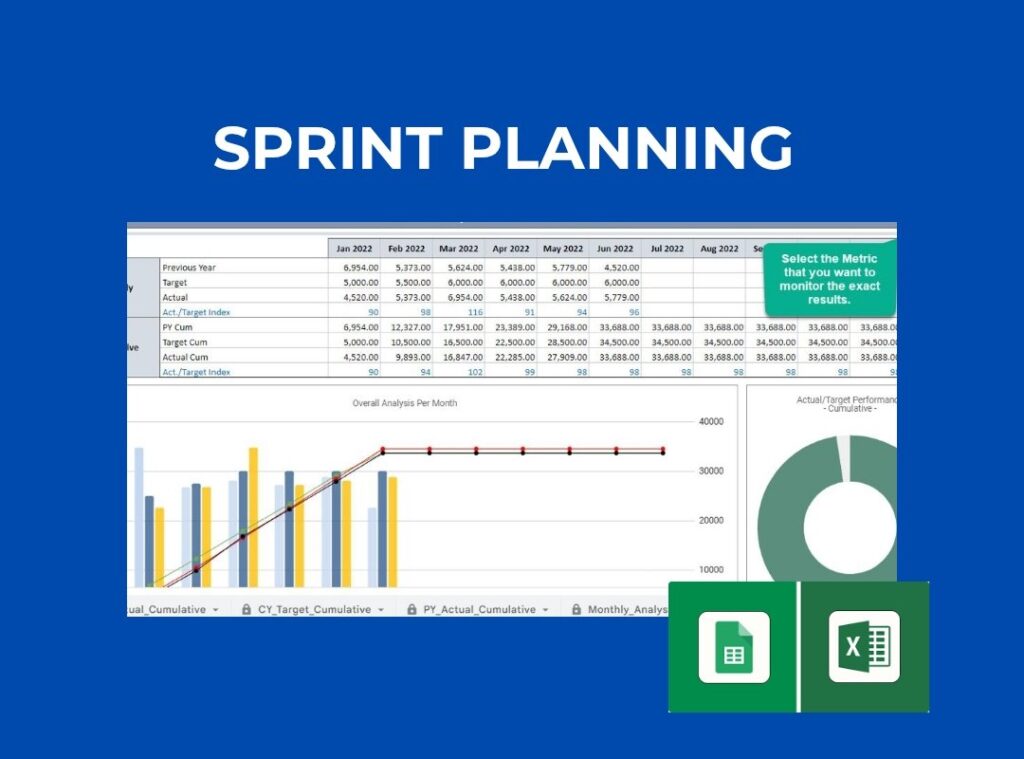
Sprint Planning Template
Organize and manage sprints effectively, ensuring agile project management practices are upheld. Keep your agile projects moving smoothly! This template is perfect for breaking down sprints, assigning tasks, and managing deadlines.
- Organize short-term tasks into structured sprints
- Improve collaboration in agile workflows
- Adapt to changes quickly with real-time tracking
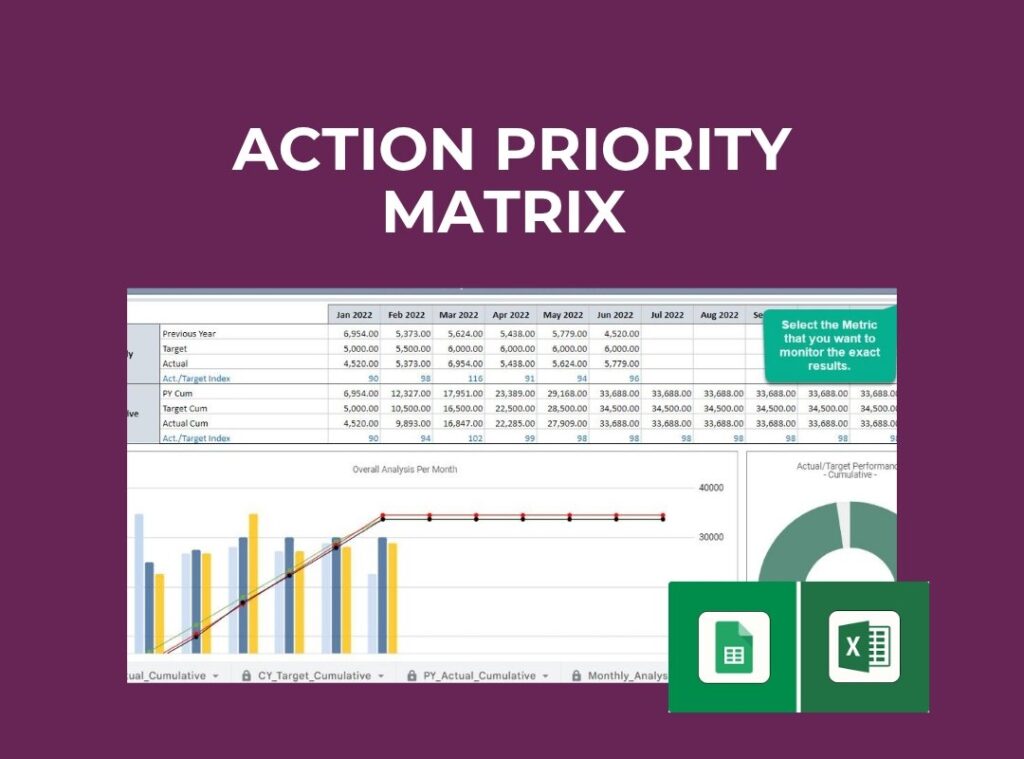
Action Priority Matrix
Prioritize tasks based on urgency and importance to optimize workflow and resource allocation. Prioritize tasks efficiently! This tool helps you focus on what truly matters by categorizing tasks based on urgency and importance.
- Identify high-impact activities for maximum productivity
- Minimize wasted time on non-essential tasks
- Improve decision-making with a clear priority matrix
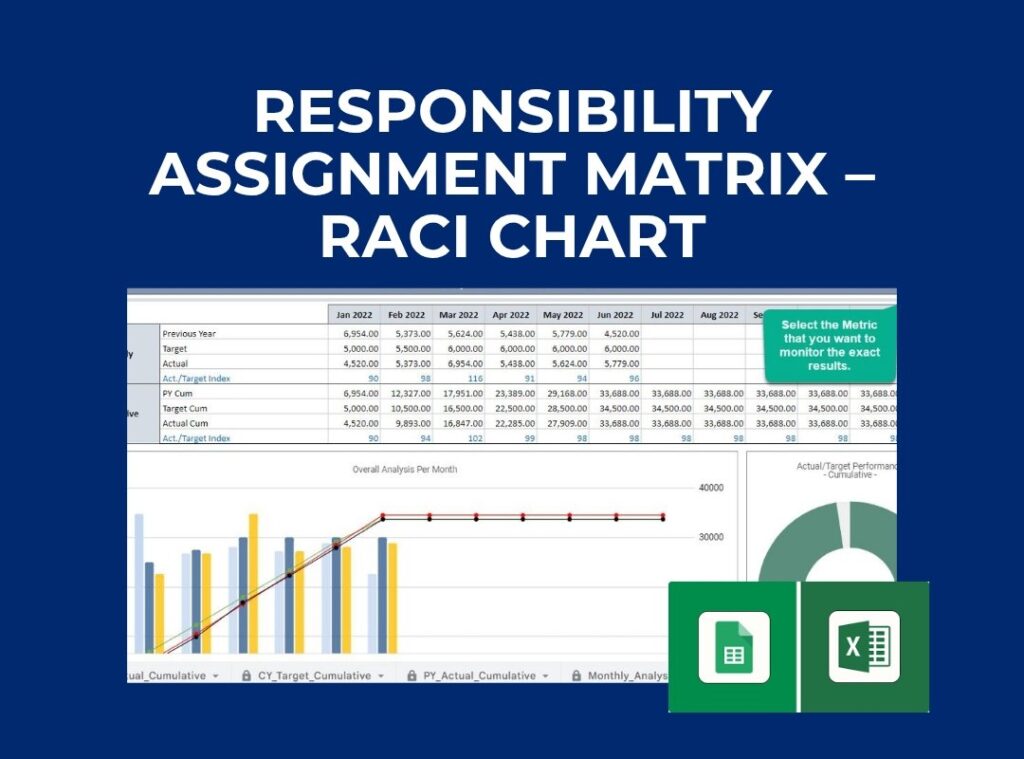
Responsibility Assignment Matrix
Clearly define team roles and responsibilities to ensure accountability and streamline communication. Define roles and responsibilities clearly to prevent confusion and improve accountability within your team.
- Assign clear ownership for every task
- Improve communication between departments
- Avoid duplication of effort with structured role mapping
Task List Template
Efficiently assign tasks, track employee responsibilities, and visualize progress through dynamic dashboards and charts. This dynamic task tracker ensures all responsibilities are assigned, monitored, and completed on time.
- Manage your team’s workload effortlessly!
- Assign tasks with deadlines and priority levels
- Track team productivity with progress indicators
- Stay organized with a structured and automated task list
Impact-Effort-Matrix
Prioritize tasks effectively and focus on what truly moves the needle in your business. The Impact-Effort Matrix Sheet helps you make smarter decisions, allocate resources efficiently, and boost productivity by identifying high-impact, low-effort tasks.
- Helps you focus on high-value activities
- Eliminates time-wasting, low-impact tasks
- Ensures resources are allocated effectively

Timeline-Sheet
Stay ahead of deadlines by organizing tasks on a structured timeline. A must-have for time-sensitive projects.
- Avoid last-minute chaos and rushed work
- See the bigger picture with a high-level project overview
- Adjust deadlines easily to stay on track
Issue Tracker Template
Log, monitor, and resolve project issues promptly to maintain project momentum and quality. Resolve problems before they derail your project! Log, monitor, and manage issues effectively with a structured tracking system.
- Identify and categorize issues instantly
- Assign responsibility for issue resolution
- Track status updates to ensure timely fixes
🚀 Why This Bundle is Essential for Every Project Manager?
Saves Time
No need to build spreadsheets from scratch—just plug in your data!
Pre-Built Formulas
See your data work like magic, without the hard work.
Easy to use
Perfect for both beginners and seasoned pros.
Eliminates Guesswork
Data-driven decision-making for better results
Boosts Productivity
Keep teams aligned, organized, and working efficiently.
Perfect for All Projects
Works for small teams, startups, and large enterprises.
Ultimate 200+ Project Management Templates

- Project Initiation
- Project Brief
- Deliverables
- Success criteria
- Communication Management Plan
- Project Outline
- Requirements Breakdown Structure
- Requirements Traceability Matrix
- Statement of Work
- Work Breakdown Structure
- Project Manager
- Action Plan
- Decision Log
- Gantt Chart
- Payroll Implementation Plan
- Production Schedule
- Project Duration Calculator
- Project Identification Template
- Project Options Template
- Project Tracker
- Quality Management Plan
- RASCI Template
- Project Tracking
- SMART Goals Template
- SWOT Analysis Template
- Team Resource Plan
- Vendor Selection Plan
- Action Item Tracker
- Portfolio Management Dashboard
- Project Management Dashboard
- Gap Analysis Template
- Issue Log (Agile/Waterfall)
- Issue Register
- Knowledge Transfer Template
- Project Decision Document
- RACI Chart
- RAID Log